This time we attempt to predict if poll responders said they’re happy or not. We also take a look at what features are the most important for that prediction.
There is a private competition at Kaggle for students of The Analytics Edge MOOC. You can get the invitation link by signing up for the course and going to the week seven front page. It’s an entry-level, educational contest - there’s no prizes and the data is small.
The competition is based on data from the Show of Hands, a mobile polling application for US residents. The link between the app and the MOOC is MIT: it’s an MIT’s class and MIT’s alumnus’ app. You get a few thousand examples. Each consists of some demographics:
- year of birth
- gender
- income
- household status
- education level
- party preference
Plus a number of answers to yes/no poll questions from the Show of Hands. Here’s a sample:
- Are you good at math?
- Have you cried in the past 60 days?
- Do you brush your teeth two or more times every day?
- Mac or PC?
- Do you drink the unfiltered tap water in your home?
- Were you an obedient child?
- Do you personally own a gun?
The goal is to predict how a person responded to “are you happy?”. While not a scientific study, this thing could produce some insights about happiness. It should be interesting to see what factors have the most impact on the target variable.
The contest is evaluated using AUC and the top of the leaderboard scores about 0.75, halfway between random and perfect.
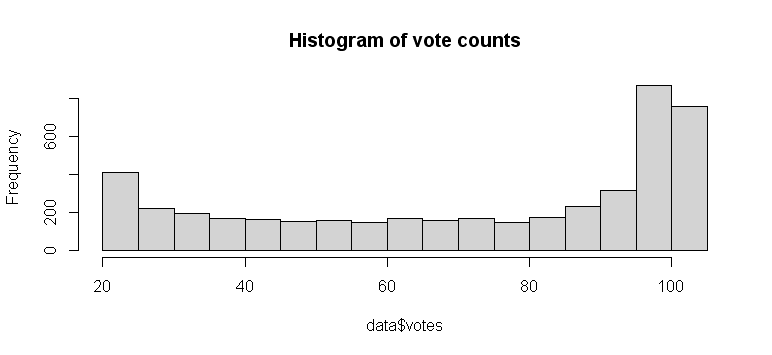
The data has a lot of missing values, because few responders answered all 101 questions. There’s a variable with vote count for each person:
Among demographics only YOB has missing values. We set them to zero - trees, specifically random forest, will understand it just right.
data$YOB[data$YOB < 1930] = 0
data$YOB[data$YOB > 2004] = 0
data$YOB[is.na(data$YOB)] = 0
It is convenient to use R, because R can handle categorical values natively, without vectorizing to one-hot encoding. Here’s how to split the training set for validation:
p_train = 0.8               # proportion of training examples
n = nrow( data )
train_len = round( n * p_train )
test_start = train_len + 1

i = sample.int( n )         # 800 1945 349 1674 735 3485...
train_i = i[1:train_len]
test_i = i[test_start:n]

train = data[train_i,]
test = data[test_i,]
We get AUC of roughly 0.7 in validation. Naive Bayes produces a similiar result. The code is available at GitHub.
What matters?
Now to see which factors are important for predicting happiness. Random Forest inherently assigns importance to variables. In R, you can plot it:
varImpPlot( rf, n.var = 18, main = "Importance of variables" )
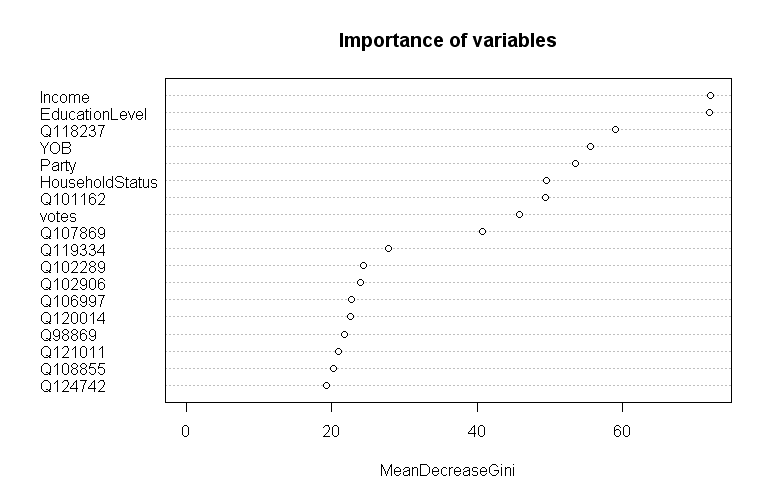
It seems that what matters is mostly demographics, with an exception of gender. Income and education level are the most important. Let’s look at the questions. Apparently there’s a gap: the three questions matter much more than the others. They are:
- 118237: Do you feel like you are “in over-your-head” in any aspect of your life right now?
- 101162: Are you generally more of an optimist or a pessimist?
- 107869: Do you feel like you’re “normal”?
Makes sense, although we probably wouldn’t pick those by hand.