Are you interested in linear models, or K-means clustering? Probably not much. These are very basic techniques with fancier alternatives. But here’s the bomb: when you combine those two methods for supervised learning, you can get better results than from a random forest. And maybe even faster.
We have already written about Vowpal Wabbit, a fast linear learner from Yahoo/Microsoft. Google’s response (or at least, a Google’s guy response) seems to be Sofia-ML. The software consists of two parts: a linear learner and K-means clustering. We found Sofia a while ago and wondered about K-means: who needs K-means?
Here’s a clue:
This package can be used for learning cluster centers (…) and for mapping a given data set onto a new feature space based on the learned cluster centers.
Our eyes only opened when we read a certain paper, namely An Analysis of Single-Layer Networks in Unsupervised Feature Learning (PDF). The paper, by Coates, Lee and Ng, is about object recognition in pictures, but the part we are interested in it’s applicable to other domains. And the idea is that when you map your features to a new space using K-means clustering, and learn a linear model on those new mapped features, you get pretty good results.
Mapping
Mapping in this context means representing each data point by its distances to all the centers. Or better yet, by radial basis functions of these distances. It means that when a distance is zero, a feature value is one. As the distance gets larger, the value quickly drops off to near-zero. You can visualize it with the following Matlab snippet.
gamma = 1
x = 0:0.01:10
y = exp( gamma * -x )
plot( x, y )

When you set gamma to a lower value, say 0.5, the function will go to zero slower:
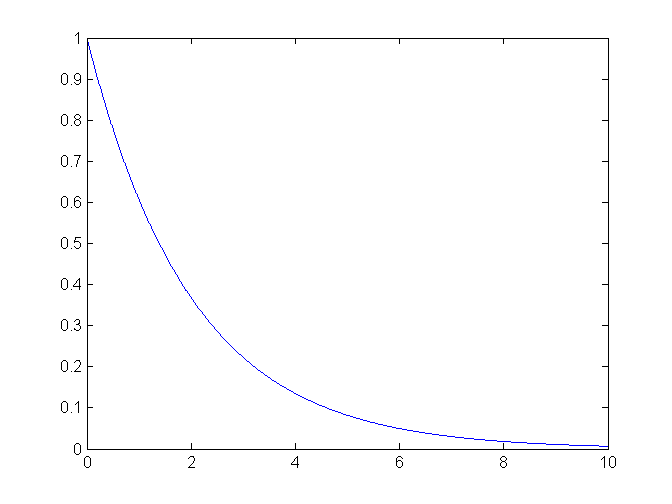
The trick is to choose gamma so that the feature values are not all close to zero or all close to one. More on tuning this param below.
If you know how SVMs work, this is the very same RBF kernel and the method generally is somewhat similiar. We are tempted to think of cluster centers as something like support vectors. The practical difference is in ability to handle larger datasets.
It is important to use many clusters (think thousands), so the resulting representation becomes that many dimensional. We compensate for it by using a fast linear learner. It seems that a more sophisticated model, like a random forest, can also be trained on mapped data, but it will be much slower.
The small print
The method suffers from the curse of dimensionality, meaning that it works best with small-dimensional data and the best you could hope for is hundreds of features*, which is not that much, depending on a dataset.
The method is also disk intensive. For example, let’s consider a dataset like Forest Cover Type with 500k data points. If we use 1000 centers, the mapping will need roughly 500k * 1000 * 10 bytes, that is 5GB. While this may be acceptable, it still feels kind of wasteful.
One solution would be to modify Sofia mapping code so that values close to zero become zeros, so that they are absent from the mapped file (it’s libsvm format). In fact, we recently did just that and some preliminary trials indicate that for a sample dataset eliminating values smaller than, say, 0.01 cuts the file sizes in half and the results achieved in terms of an error metric are the same, if not slightly better.
That won’t be enough for larger datasets. Another solution is to sparsify more extremely, by leaving only a small fraction of features - those with biggest values - and setting the rest to zero.
We have added --cluster_mapping_sparsity <a number of clusters> parameter for this. Using it results in slightly worse supervised learning scores, but the output files are way smaller. For example, consider mapping to 1000 clusters vs 20 clusters: a 50 times difference.
In practice
Here’s the procedure:
- run Sofia K-means to find cluster centers
- map the data to these centers using RBF
- learn a linear model on the mapped data
Simple as that. There are two hyperparams to optimize: a number of centers for K-means and gamma, called cluster_mapping_param in Sofia. The latter is needed so that feature values will be nicely spread between zero and one, instead of being all close to zero or all close to one. The two params seem to be rather independent of each other. You might also try cluster_mapping_threshold, if using our version of Sofia.
The actual clustering command might be:
sofia-kmeans --k 1000 --init_type optimized_kmeans_pp --opt_type mini_batch_kmeans --mini_batch_size 100 --iterations 500 --objective_after_init --objective_after_training --training_file data/train.libsvm.txt --model_out data/model_sofia --dimensionality 9
You can find explanation for all these options, as well as a more detailed tutorial, on sofiaKMmeans website. Here it’s important to note that we specify a training file in libsvm format, and an output file for the model. The model is saved also in libsvm format. We need to specify dimensionality of the data, that is a number of features, including a label. Otherwise, the model file is going to be very big and mostly zeros.
The next step is mapping:
sofia-kmeans --model_in data/model_sofia --test_file data/train.libsvm.txt --cluster_mapping_out data/mapped_train.libsvm.txt --cluster_mapping_type rbf_kernel --cluster_mapping_param 0.5 --cluster_mapping_threshold 0.01
In goes a model and a file to map, out comes a mapped file (still in libsvm format). At this point, you can use software of your choice to build a linear model from the mapped file. We use Vowpal Wabbit, so we need to convert data to VW format. This basically amounts to adding “|” after a label and can be done with a simple script, libsvm2vw.py.
Some results
For kin8nm, we got RMSE = 0.09, which is much better than a random forest’s result (0.13 - 0.14). For Madelon, AUC score is slightly better than from random forest, slightly meaning 40 places on the leaderboard.
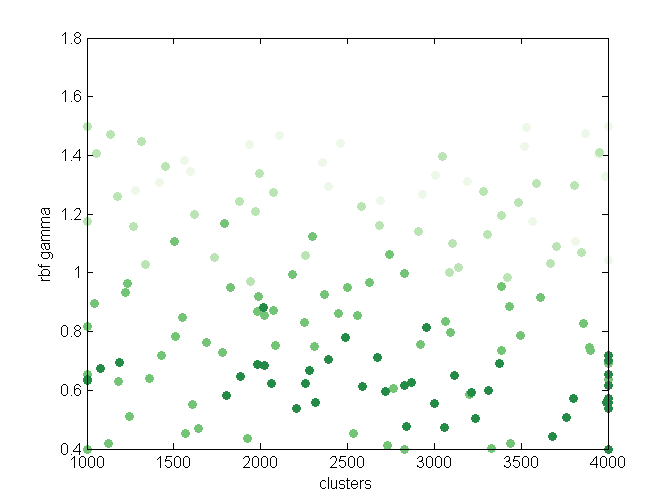
The plot below shows the results of tuning hyperparams for kin8nm with Spearmint. The darker the color, the better.

As you can see, gamma close to 0.4 seems to be the best across the board. The number of clusters, once big enough, isn’t that important. Similiar story with Madelon, only more settings tried out and best gamma is roughly 0.6:
The code and data for these experiments is available at Github.
*A paper specifically about K-means: Learning Feature Representations with K-means