Kaggle again. This time, solar energy prediction. We will show how to get data out of NetCDF4 files in Python and then beat the benchmark.
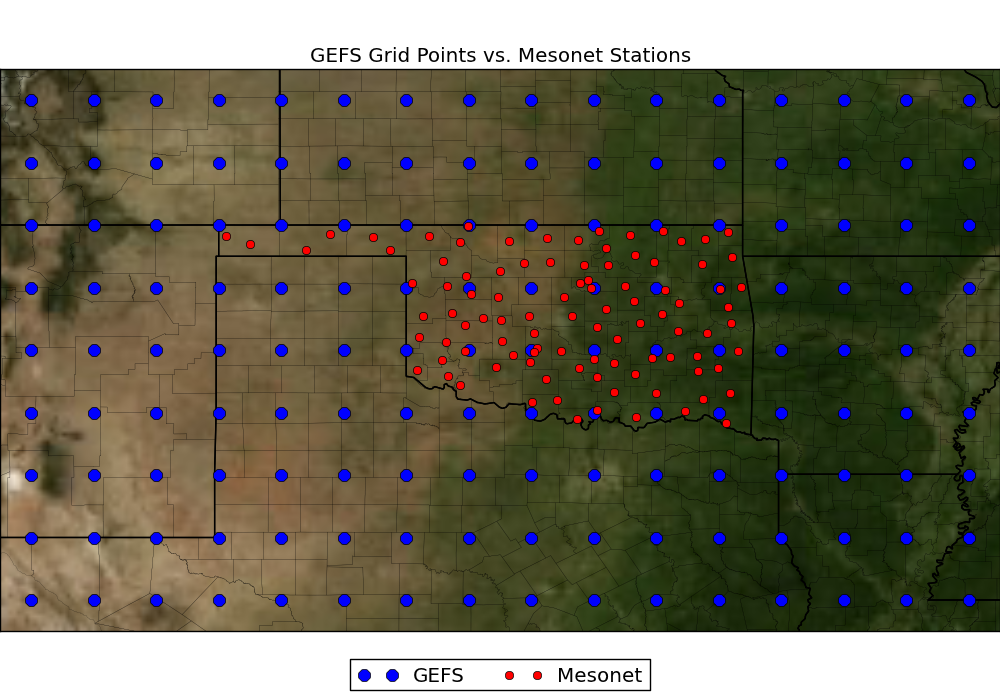
The goal of this competition is to predict solar energy at Oklahoma Mesonet stations (red dots) from weather forecasts for GEFS points (blue dots):
We’re getting a number of NetCDF files, each holding info about one variable, like expected temperature or precipitation. These variables have a few dimensions:
- time: the training set contains information about 5113 consecutive days. For each day there are five forecasts for different hours.
- location: location is described by latitude and longitude of GEFS points
- weather models: there are 11 forecasting models, called ensembles
NetCDF4 tutorial
The data is in NetCDF files, binary format apparently popular for storing scientific data. We will access it from Python using netcdf4-python. To use it, you will need to install HDF5 and NetCDF4 libraries first. If you’re on Windows, it’s best to use binary packages, because building from source seems quite tricky. Ready?
>>> import numpy as np
>>> import netCDF4 as nc
>>> data = nc.Dataset( 'apcp_sfc_latlon_subset_19940101_20071231.nc' )
>>> data
<netCDF4.Dataset object at 0x01110D68>
NetCDF dataset contains variables, modeled as an OrderedDict in Python. This data structure is a cross between a dictionary and a list, meaning that you can access elements both by name and by index.
>>> for v in data.variables.keys():
...     print v

time
intTime
lat
lon
ens
fhour
intValidTime
Total_precipitation
The variable of interest always comes last in the contest data, the rest are mostly dimensions of the main variable.
>>> precip = data.variables.values()[-1]
>>> precip.dimensions
(u'time', u'ens', u'fhour', u'lat', u'lon')

>>> precip.shape()
(5113, 11, 5, 9, 16)
As you can see, there are 5113 days, 11 models, 5 times each day and 9 x 16 grid of points. Let’s take a look at the dimensions. This time we’ll reference values:
>>> for d in data.dimensions.values():
...     print d

<type 'netCDF4.Dimension'>: name = 'time', size = 5113
<type 'netCDF4.Dimension'>: name = 'lat', size = 9
<type 'netCDF4.Dimension'>: name = 'lon', size = 16
<type 'netCDF4.Dimension'>: name = 'ens', size = 11
<type 'netCDF4.Dimension'>: name = 'fhour', size = 5
You can access a variable by name:
>>> lat = data.variables['lat']
>>> lat.shape
(9,)
Up to this point, we’ve been on NetCDF territory. To get actual values, we cross over to numpy:
>>> l = lat[:]
>>> l
array([ 31.,  32.,  33.,  34.,  35.,  36.,  37.,  38.,  39.], dtype=float32)

>>> np.where( l == 33. )
(array([2]),)

>>> np.where( l == 33. )[0][0]
2
So now we know that if we are interested in latitude value 33, the relevant index will be 2. The same thing with longitude:
>>> lon = data.variables['lon']
>>> n = lon[:]
>>> n
array([ 254.,  255.,  256.,  257.,  258.,  259.,  260.,  261.,  262.,
        263.,  264.,  265.,  266.,  267.,  268.,  269.], dtype=float32)

>>> np.where( n == 260. )[0][0]
6
So let’s say we’d like data for a point at (33,260). The appropriate indexes are 2 and 6:
>>> p_33_260 = precip[:,:,:,2,6]
This reduces the dimensionality to days, models and hours:
>>> p_33_260.shape
(5113, 11, 5)
We’d like two-dimensional data for saving in a text file, like CSV. One way would be to average predictions from each model:
>>> p = np.mean( p_33_260, axis = 1 )
>>> p.shape
(5113, 5)
Now we have data for a given point by days and hours. Another possibility is to keep both model and hour dimensions but reshape data to 2D:
>>> p = p_33_260.reshape( p_33_260.shape[0], p_33_260.shape[1] * p_33_260.shape[2] )
>>> p.shape
(5113, 55)

>>> np.savetxt( '33_260.csv', p, delimiter = ",", fmt = "%.06f" )
To wrap this up, here’s a script for extracting data for a given GEFS point.
> gefs2csv.py apcp_sfc_latlon_subset_19940101_20071231.nc precip_33_260.csv 33 260

lat: 31...39, lon: 254...269

Total_precipitation:
Total_precipitation_Accumulation (Accumulation for  Mixed Intervals) @ surface

data shape: (5113, 5)

>
Beating the benchmark
For starters, we will use modified code from Alec Radford. It employs sklearn.linear_model.Ridge, a L2 regularized linear model. One nice thing about Ridge is that it can predict multiple targets simultenously, meaning we can train and predict for all stations in one go:
y : array-like, shape = [n_samples] or [n_samples, n_targets]
As usual, the code is available at Github. Our contribution here is twofold:
- we do not average over hours
- we use fewer GEFS points for predictions (10x4 grid instead of 16x9)
The first factor increases dimensionality five times, the second reduces dimensionality 3.6 times , so overall dimensionality goes up by 38%, to 3000. We deal with it by increasing regularization coefficient. Validation error goes from 2260k to 2230k. A public leaderboard score is 2215k.
Our game plan and results
Here’s a game plan we thought might produce good results. For each station:
- extract data for up to four nearest GEFS points, as described above
- stack it horizontally, add targets for the station
- train your non-linear regressor
Then combine predictions for each variable into a submission file.
It didn’t work out that well. When we used random forest, we got 2258k. Ridge produced 2263k. It seems that reduced dimensionality doesn’t bring immediate rewards here.